HTTP/HTTPS
Monitors status codes, response times and content assertions for any URL. Detects redirects, timeouts and content drift in seconds.
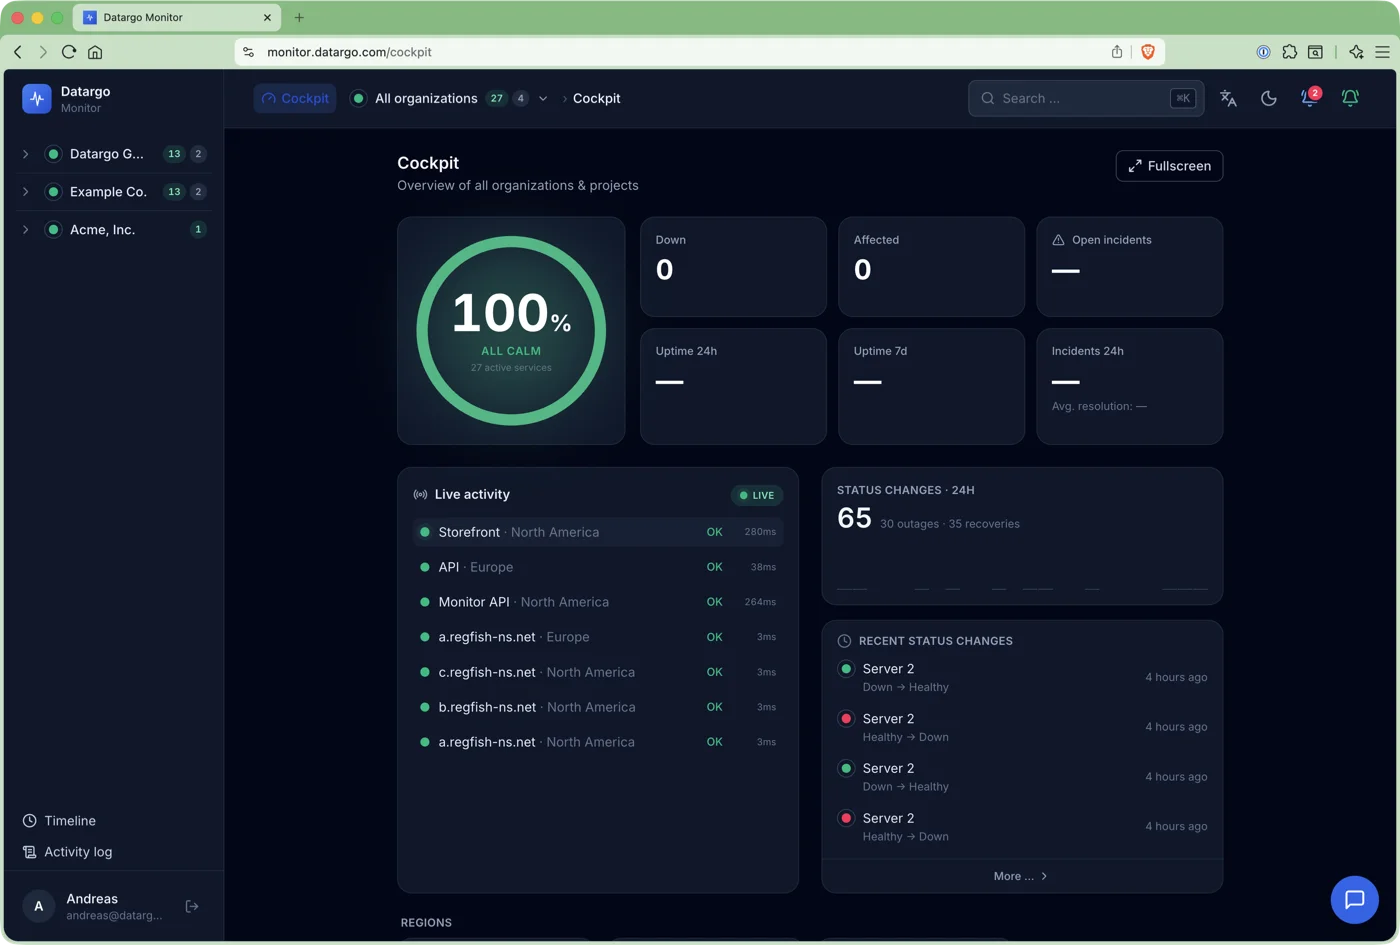
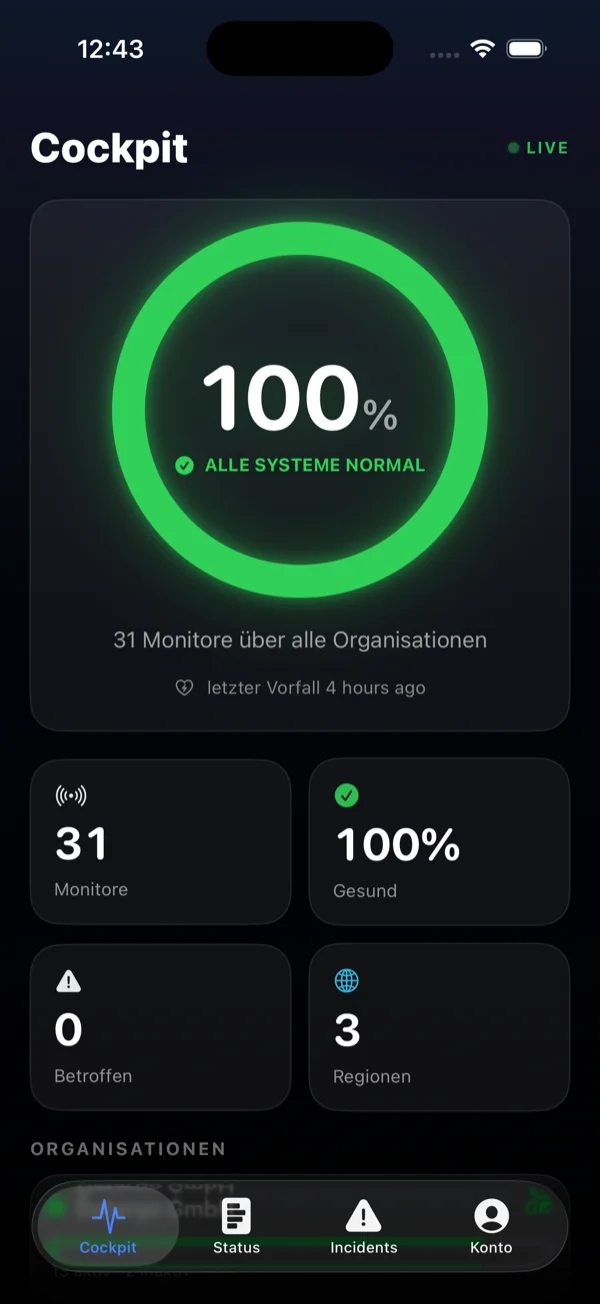
Datargo Monitor checks your entire infrastructure from three global regions and confirms every outage multi-regionally before your team receives the first customer report. NIS2-ready, EU-hosted in Frankfurt, native iPhone & iPad app included.
From HTTP to Traceroute: Datargo Monitor covers the full protocol range that SysAdmins and IT managers in regulated environments require.
Monitors status codes, response times and content assertions for any URL. Detects redirects, timeouts and content drift in seconds.
Checks DNS resolution, record types and response times. Detects propagation errors and DNS hijacking immediately, before users are affected.
Monitors expiry dates, certificate chains and cipher suites. Alerts weeks before expiry so no certificate lapses unnoticed.
Checks reachability and latency on any TCP port. Ideal for databases, internal services and proprietary protocols without an HTTP interface.
Tests SMTP connections, banners and response codes. Ensures your mail stack stays reachable and messages are not silently discarded.
ICMP ping with packet-loss measurement and RTT tracking. The fastest indicator of whether a host is fundamentally reachable.
Traces the network path hop by hop and detects routing changes, latency spikes and failed intermediate nodes before users report issues.
Every alert is automatically confirmed by at least two additional nodes. No false alarms from a single monitoring location's local network problems.
See every change the moment it happens, and drive everything via API.
Every status change, every check and every incident streams to your dashboard in real time, with no reload and no polling. Outages appear the moment they happen.
Full programmatic access to monitors, incidents, metrics and configuration. Automate onboarding, reporting and integrations with documented endpoints.
The full power of Datargo Monitor, no credit card, no auto-renewal. Take your time to decide whether it fits your team.
No agent, no deployment, no infrastructure: create a monitor, choose a region, configure notifications.
Enter a URL, hostname or IP, select a protocol and set the check interval. Productive in under two minutes.
Three global nodes check independently. An alert is only triggered once multiple regions confirm the outage.
Push notification to iPhone and Apple Watch, email or webhook. Your team knows before the first customer call arrives.
Full incident history with timestamps, affected regions and response times. NIS2-compliant, documented and exportable.
EU-hosted, NIS2-ready, no US CLOUD Act exposure. Try Datargo Monitor for free or book a personal demo.